![]() Detailed description of E3database
Detailed description of E3database
![]()
| "E3database - An Introduction into the Life-Cycle Analysis Tool" |
Content
Scope
Properties
System boundaries
Advantages of using E3database
Processes and inputs / outputs
Chains
Calculation algorithm
Dealing with co-products: allocation methods
Results
Examples of basic chain types
References ![]()
| Introduction |
This introduction deals with the relationship between Life-Cycle-Assessment LCA) and the E3database tool.
E3database is a tool in the context of LCA and Well-to-Wheel Analyses. It allows the modelling and comparison of all types of energy chains / pathways from primary energy source to final energy use.
LCA is the comprehensive analysis of the environmental impact caused by a product during its life cycle, comprising its
- production
- use, and
- disposal.
Environmental impact is mainly caused by the consumption / transformation of materials and energies. Therefore LCA looks at
- material flows,
- energy use,
- associated emissions (especially greenhouse gas emissions),
- and economics.
A comprehensive definition of LCA is given in ISO 14040 ff.
LCA has to cope with a number of difficulties, e.g.:
- relevant data are uncertain and may vary to some extent,
- or are not available in some cases,
- some technologies considered are still under development,
- it is not always clear, where to draw the boundary for the analysis,
- there is the methodological problem of dealing with by-products and credits,
- there is practically an infinite number of possible fuel pathways,
- but only few make sense (which then is already a result of an LCA).
But despite the theoretical and practical limitations of LCA, this is the best method we have to assess and compare different energy systems.
LCA will always be work in progress. But it helps our understanding of energy systems and gives orientation where to look for the more sustainable solutions.
LCA of fuels has to analyse material flows, energy flows, emissions and economics caused by
(1) the production of the fuel supply infrastructure and of the vehicles,
(2) the production of the final fuel,
(3) the use of the fuel (therefore the vehicle has to be included in the analysis!),
(4) the dismantling and disposal of supply infrastructure and vehicles.
Topics (2) and (3) are addressed in Well-To-Tank and in Tank-To-Wheel analyses. A comprehensive LCA should also investigate topics (1) and (4). But this is often not done, due to
- a difficulty of data collection and/or
- a presumption that the effects are of minor importance.
E3database is a tool in the framework of LCA for the modelling of energy chains from “Well-to-Wheel”. The tool facilitates the evaluation and calculation of:
- energy use,
- greenhouse gas (GHG) emissions,
- air pollutant emissions,
- costs.
E3database ensures full transparency of modelling assumptions and calculations. Transparency of data and methods is a precondition for a rational discussion of LCA results.
E3database is now frequently used for the modelling of fuel pathways for transport systems with primary energy sources based on either fossil energies, or biomass or nuclear or renewable electricity. But the tool is not confined to this area of applications, it is possible to use the tool for the modelling of all kinds of energy pathways.
| Scope and properties |
Scope
E3database is a tool for “Well-to-Wheel” analyses (in more general terms: a tool for “source-to-use” analyses). It is designed to be used for
- the calculation of energy and emission balances,
- economic analyses,
- regional analyses,
- sensitivity analyses and stochastic analyses.
Possible areas of application are
- modelling of energy chains,
- energy scenarios,
- certification of transportation fuels,
- certification of consumer goods,
- certification of (green) electricity.
Properties
E3database is well structured and subdivided into a calculation tool and a data database containing all input data. By using the approved calculation tool the user can concentrate on the empirical aspects of modelling.
The user is fully flexible to use existing data or to add individual customer databases or a mix of both. Databases can be shared or published to harmonise or compare assumptions between user groups.
E3database is easy to use through it's graphical user interface and it's full transparency of the underlying data.
Principal properties of the E3database tool are:
- being a tool to facilitate the modelling of energy chains by experts,
- ability to use information as is available from whatever sources on whatever level of aggregation,
- comprehensive documentation of data, assumptions and data sources integrated in the tool,
- separates data storage from data manipulation (input and output) and calculations,
- Graphical User Interface for data input and modelling of energy chains,
- implementation of calculation algorithms independent of specific chain modelling,
- ensures physical and technical viability and correctness of chain modelling,
- ensures consistency of data and correct calculation results in accordance with implemented calculation algorithm,
- allows transparent modelling of very complex chains,
- facilitates data exchange between partners in distributed projects.
The user is responsible for
- the validity and correctness of all data describing the basic processes in an energy chain,
- the technical rationale behind the modelling of an energy chain.
However, there are also some limits of the E3database tool. E3database is a TOOL and not a MODEL (like e.g. MARKAL). Therefore
-
the tool does not perform any optimizations,
-
no trade-offs between different criteria can be carried out,
-
modelling of evolution over time is not possible.
E3database can be used to supply basic data for a more comprehensive evaluation of energy chains and regional scenarios by the user.
System boundaries
For the modelling of energy chains
- non-renewable (fossil, nuclear) and
- renewable energy sources
are taken into account and are presented separately.
For the calculation of the energy requirements the so-called efficiency method is used (similar to the procedure adopted by international organisations like ECE, EUROSTAT, IEA):
- In this method the efficiency of electricity generation from nuclear power is based on the heat released by nuclear fission which leads to an efficiency of about 33%.
- In the case of electricity generation from hydropower and other renewable energy sources which cannot be measured in terms of a calorific value (wind, solar energy), the energy input is assumed to be equivalent to the electricity generated which leads to an efficiency of 100%.
The following emissions are considered in the E3database tool:
- Greenhouse gases (GHG):
CO2, N2O, CH4, CF4, SF6, HFC 134a. - Air pollutant emissions:
NOx, SO2, CO, NMVOC, Dust/PM.
The GHG emissions are also expressed as CO2 equivalents. For example: CO2 =1; CH4 = 23; N2O = 296.
Advantages of using E3database
Why use the E3database tool?
- Facilitate the modelling of energy chains
- Maximum flexibility in using improved / alternative data from any source
- Transparency of assumptions and integrated documentation
- User can concentrate on validity of data and adequacy of modelling
- Easy communication of assumptions and results
- Easy to install and run on personal computers
- Important features are virtually impossible with Excel-based tools and implementations
Hard- and software
The E3database software consists of two parts: the E3database program (comprising the graphical user interface, the database frontend and the calculation algorithm) and an SQL database management system (containing all data required for the modelling of energy chains).
The program has been developed using the Borland Delphi programming language. The graphical user interface assists the user in the input of data into the database and in the modelling, storing and calculation of energy chains. All calculations of the chains are carried out in this program.
The SQL database is used for storing all the basic input data and the data describing the modelling of the energy chains. The open source SQL database Firebird is used. It can be installed and run on a local computer or on a server within an intranet.
Calculation results are not stored in the database but can be exported for storage and further processing (e.g. in Excel spread sheets).
Hardware and software requirements are:
- Personal Computer
- Operating System MS Windows 2000 or Windows XP
- Firebird SQL database management system
- E3database program (software based on Borland Delphi)
for data input/output, modelling and calculations
E3database software
-
is easy to install,
-
has a small footprint (10 MB for program and system files plus storage place for databases).
The software can even be run from a memory stick.
A connection to the internet is desirable (it is necessary for data exchange between partners, but is no functional requirement for the tool itself).
| Modelling of energy pathways |
The following sections describe the modelling of energy pathways in the E3database tool.
First, the basic entities are described. These are processes with their inputs and outputs together with the basic data used in the tool. Energy chains are entities constructed by connecting different processes to model an energy pathway.
Then, for energy pathways the algorithm for the calculation of the energy consumed, the emissions and costs is described.
Different methods for the modelling of energy chains with co-products are described.
The calculation results delivered by the E3database are described.
Also, simple examples are given to demonstrate the modelling of energy pathways.
Processes and inputs / outputs
A process is used in E3database to model basic entities in energy pathways. A process can model a a wide variety of installations, plants, transport systems, technical components etc.
For instance, a process can describe a plant for energy generation (e.g. a coal fired power plant or a windmill), a plant for the conversion of energy (like a refinery or a steam reformer) or a filling station or a power transmission, a truck, a passenger vehicle, etc.
When defining a process, the level of aggregation can be chosen by the user. The definition (and interpretation) of what constitutes a process is very flexible as there is no predefined level of abstraction or aggregation. For instance, one can model a process “electricity from biomass“ where the input is biomass and the output is electricity. But it would also be possible to split this aggregated process into three separate processes, e.g. “fermentation“, “gas cleaning“ and “electricity generation“ which have to be connected with each other to form a chain (see below).
A process can be any entity converting one or more inputs into one or more outputs. Every process is modeled as being a “black box“ . A process has the following properties:
- Every process has a unique name.
- A process is described with regard to
> plant size (“process scale”)
> time horizon. - A process has inputs and outputs (called “materials”) with corresponding specified dimensions.
- One output has to be defined as being the “main output”.
- For every input, the amount has to be specified which is required to generate one unit of the main output.
- A process has specified amounts of emissions.
- A process is described with regard to economic data.
The data describing a process can be differentiated with respect to time horizon, upper and lower boundaries for certain parameters, and also probability distributions for certain values can be given. Stochastic data can be used to carry out Monte-Carlo simulations.
The following screen shot shows the window in the E3database tool describing individual processes.
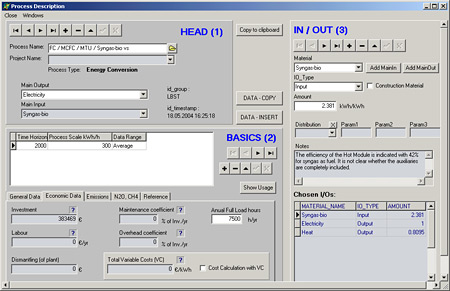
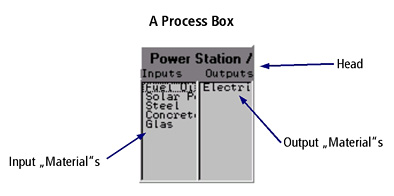
The screenshot (above) shows how a process is represented on the Graphical User Interface. This representation states only the name of the process and all its inputs and outputs.
Every type of input and otput is regarded to be a “material“. In E3database:
- A “material” can be a material in the every day meaning:
e.g. concrete, steel, copper, etc. - A “material” can be an energy flow:
e.g. crude oil, natural gas, coal, electricity, heat, etc. - A “material” can be any kind of “service” provided:
e.g. vehicle-km, truck-km, ton-km, etc. - “Materials” are described with regard to their type, their units
and other properties needed for the modelling of energy pathways.
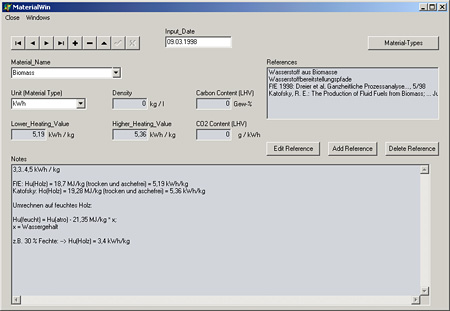
The screenshot below shows the window in E3database for the definition and description of inputs and outputs (“materials”).
For the creation of a new process, at least the following data are required:
- process name,
- main input,
- main output,
- time horizon,
- process scale,
- data range (min, max, average),
- values for the amounts of all input(s) and output(s).
Energy data
Many processes have inputs and outputs being energies. All types of renewable and non-renewable (fossil, nuclear) energy sources are possible in E3database.
When modelling fuels derived from biomass, the renewable energy use includes the energy content of the harvested biomass (i.e. the lower heating value (LHV) of the dry matter).
For the calculation of the energy requirements the so-called efficiency method is used (similar to the procedure adopted by international organisations like ECE, EUROSTAT, IEA):
- In this method the efficiency of electricity generation from nuclear power is based on the heat released by nuclear fission which leads to an efficiency of about 33%.
- In case of electricity generation from renewable energy sources which cannot be measured in terms of a calorific value ( hydropower, wind, solar energy), the energy input is assumed to be equivalent to the electricity generated. This leads to an efficiency of 100%.
Emission data
In E3database, emissions are associated with processes. The following emissions can be modelled:
- Greenhouse gases (GHG):
CO2, N2O, CH4, CF4, SF6, HFC 134a - The emissions are also expressed as CO2 equivalents.
For example: CO2 =1; CH4 = 23; N2O = 296. - Air pollutant emissions: NOx, SO2, CO, NMVOC, Dust/PM
Economic data
Economic data are associated with processes. There are two alternative ways to state economic data:
-
Detailed economic data can be stated for investment, economic lifetime, O&M costs, interest rates, etc. They are used to calculate aggregate or specific costs.
-
Specific costs for the main output.
Chains
Energy pathways are perceived to consist of a collection of individual processes which are connected in a specific way by their respective inputs and outputs.
The modelling of an energy pathway in E3database by a collection of processes and their connections is called a chain.
Properties of a chain:
- A chain is any energy pathway consisting of two or more “processes”.
- Typically, a chain starts with one or more primary energies (and other “materials”) and ends with the provision of a final energy or a service (“Well-to-Tank”, “Well-to-Wheel”).
- A chain has a unique name.
- Processes in a chain are connected via inputs and otputs (“materials”).
- Every chain has a final process (called the “tail” process).
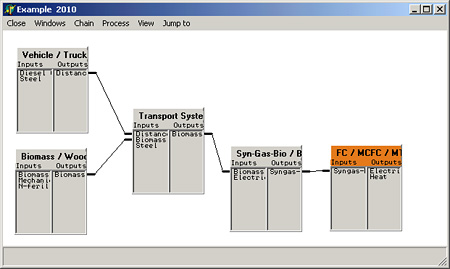
A chain typically represents an energy pathway from well to wheel. The following screenshot shows a simple chain for the supply of electricity produced from biomass: The chain consists of five processes, all symbolised by a process box. The biomass is transported to a gasifier where it is converted to syngas. The syngas is finally converted in the tail process - a Molten-Carbonate-Fuel-Cell (MCFC) - to electricity, the by-product being heat.
Making use of the Graphical User Interface of E3database, a chain can be modelled by placing individual processes on an empty screen in the Chain window and connecting the processes by clicking with the mouse on corresponding inputs and outputs. Only inputs and outputs of the same type can be connected.
The tool ensures full transparency for complex energy chains. The modelling follows a strict bottom-up approach: starting with inputs and outputs (materials) being – as it were - properties of processes, and defining processes which are then aggregated to chains.
The tool assists the easy modelling of chains (initial setting up of a new chain, modifications and extension of existing chains). This demonstrates: E3database is a tool to greatly facilitate the modelling of energy chains.
For the chains / pathways modelled with E3database, the tool calculates results for energy use, air pollutants and greenhouse gas emissions as well as costs. Results can be compared in a transparent way and sensitivity analyses can easily be carried out.
Calculation algorithm
The evaluation of energy pathways is done by calculating for a modelled chain:
- energy use,
- greenhouse gas (GHG) emissions,
- air pollutant emissions,
- costs.
The primary aim of the calculation algorithm is to determine the aggregate amount for all types of inputs in the chain which are necessary to supply the required output of the tail process. This result describes the “activity level” of all processes in the chain and is the basis for the subsequent calculation of emissions and costs.
Deterministic calculation
The calculation algorithm works from the tail process of a chain backwards through all processes in the chain moving along the input/output relations. For every process the values for all inputs are calculated which are necessary to supply the required output amount.
In the case of deterministic calculation, the input and output values, as well as the corresponding emissions, for all processes have only one value.
The calculation algorithm
-
is implemented only once in the program,
-
is programmed as a recursion,
-
is independent of the shape, size or complexity of a chain.
Every chain will be calculated in the same manner, regardless of the type of technology, represented by the chain.
Examples for the working of the algorithm are described in full detail in the User Guide.
After the basic calculation for all inputs and outputs (i.e. energies, materials and services) for a chain is done, the resulting emissions are calculated:
- For every process in the chain the emissions are calculated according to its previously calculated “level of activity” (i.e. the quantified inputs and outputs necessary to supply the final chain output).
- Emissions of all processes are summed up resulting in the total emissions for the chain.
The basic calculation for a chain determining the output level of all processes is also the basis for subsequent cost calculations.
There are important consequences of this algorithmic implementation in E3database:
- Correctness of calculation results is guaranteed by the properties of the tool.
- The user can concentrate on the empirical aspects of modelling!
Monte-Carlo calculation
In the case of Monte-Carlo calculations, the input and output values, as well as the corresponding emissions, for some processes, can have stochastic distributions. The calculations are carried out as many times as is decided by the user. For each iteration for every process in the chain the parameters subject to randomisation are determined randomly before starting the calculation.
The stochastic features of the tool were implemented to enable quantification of uncertainties through confidence intervals around “best estimates”. For all the key individual processes within e.g. a fuel chain (i.e., the main steps of production, conditioning, transport, handling, and discharge), parametric probability values can be determined and then implemented to stochastically simulate the range of uncertainty for the overall pathway in question. This permits the calculation of 20th%-ile, 50th%-ile and 80th%-ile values of the frequency distribution of the result parameters.
Stochastic variations of input or output values are possible for the following parameters:
- energy inputs,
- material inputs like concrete, steel,etc.,
- CH4 emissions.
As a result, the variation of emissions is a function of varying energy inputs
- CO2 emissions,
- CO2-equivalent emissions.
Also the level of N2O emissions can be subject to stochastic variations not dependending on other inputs or outputs.
Different probability distributions for the randomisation of parameters are possible:
- normal distribution (Gauss),
- triangle distribution,
- double triangle distribution,
- equal distribution.
Dealing with co-products: allocation methods
For the modelling of co-products and credits different allocation methods can be applied:
- allocation by mass,
- allocation by energy,
- substitution method.
For each method, chains have to be modelled accordingly.
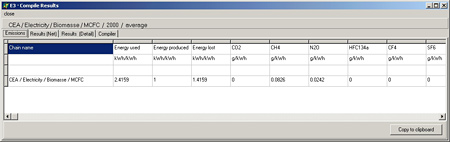
Results
Presentation of calculation results Well-to-Wheel calculations for energies, emissions and costs are done on demand. Results are not stored in the database, but can be exported to Excel for further processing. Templates are shown for the presentation of results for:- Chains
- Regional supply scenarios
- Regional demand scenarios
Examples of basic chain types
The following examples of basic chain types show, how E3database handles different kinds of connections between processes.
Two processes are connected by defining an input/output relation. This is only possible when the Main Output of the supplying process is of the same type as the Input of the receiving process.
These connections are implemented by the user in the Graphical User Interface. By clicking with the mouse on the corresponding input and output of two process boxes the connection is established. If the user trys to connect an input with an output of a different type, the program denies the setup of the connection. In this way the program ensures the physical validity of the modelled chain.
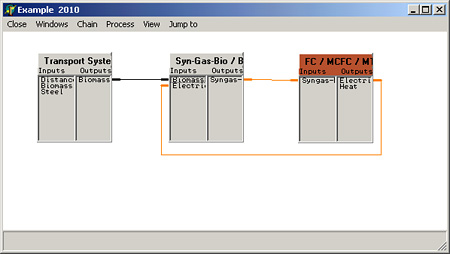
Simple chain
The chain below models the generation of electricity by a Molten-Carbon-Fuel-Cell (MCFC): the input into the MCFC is syngas which is produced in a gasifier which gasifies biomass; the biomass has to be transported to the gasifier.
A simple chain in this context is a chain without a feedback connection and without any co-products. (The MCFC shows the additional output “Heat”, but this output is not used in the chain below.)
The E3database calculation algorithm starts at the “Tail Process” (marked orange in the screenshot below) and works backwards until it ends at the processes on the left side of the screenshot.
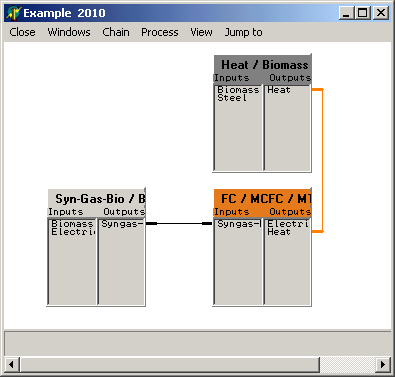
Chain with co-product
The fuel cell (MCFC) operated as a combined heat and power plant in the screenshot below is a typical example of a chain with co-production. The chain is modelled in such a way as to allow the calculation of a credit for the co-product (i.e. allocation by the substitution method).
This chain has as main output “Electricity” and as co-product the output “Heat”. To account for the benefit of the co-production, the tail output “Heat” of a process which would be substituted by the MCFC (in this case the process “Heat / Biomass” which generates heat by burning biomass) must be connected with the co-product output “heat” of the “FC / MCFC” process.
Due to the way how this chain is modelled, the E3database algorithm caculates this chain with the substitution method. In this chain “Heat / Biomass” represents the tail process of the substituted chain (in this example consisting only of a single process). The formal criterion for the substitution is the fact that two processes are connected via an output/output relation (and not, as is usual, by an input/output relation). In the calculation of the chain, all emissions and energy consumptions of the “Heat / Biomass” chain will be substracted from the “FC / MCFC...”chain.
The definition of which output is a “Main Output” and which is a “Co-Product” is done by the user.
Chain with recursion
In some cases, certain processes within the chain need an input which is produced as a main output in one of the following processes. In such a case, the result is a feedback connection as shown in the example in the screenshot below.
In this case the E3database algorithm detects the feedback and a recursive calculation is started. The recursive calculation comes to an end when the difference between the result of the current iteration to the result of the preceding iteration is less than a value predefined by the user as a break condition.
| References |
E3database has been and is used in many projects and studies:
- Well-to-Wheel analyses of alternative fuels and drive systems for road transport
e.g. “Transport Energy Strategy” (TES). [1998-2001, 2006] - GM European Well-to-Wheel Study. [2002]
- CONCAWE, EUCAR, JRC: Well-to-Wheels Analysis of Future Automotive Fuels and Powertrains in the European Context. [2003-ongoing]
http://ies.jrc.ec.europa.eu/WTW - GermanHy.[1998-2001, 2006]
- HyWays. [2003-2007]
http://www.hyways.de - Analyses for energy systems in space.
- Fuels for aircraft and ships.
- Energy scenarios.
Present applications are for clients in
- Car industry
- Utilities
- Oil industry
- Gas industry and process industry
- Research institutions
E3database is a promising tool also for prospective clients in
- Commerce (logistics, food, ...)
- Consulting
- Certifying bodies